2.1 Introduction to VNCs and Projections
Lesson Progress
Not completed
This lesson provides an introduction to the VFR Navigation Charts (VNCs) used on the HAGAR examination.
What is a VNC?
Section titled “What is a VNC?”VFR Navigation Charts (VNCs) are used by VFR pilots. The chart displays aeronautical information and sufficient topographic detail to facilitate air navigation through the use of a unique colour scheme, layer tinting, and shaded relief.
- Scale: A VNC chart scale is 1:500,000.
- Coverage: There are 52 charts in the series that cover all of Canadian airspace.
Where to find them
Section titled “Where to find them”NavCanada does not provide VNCs for free; they sell them in paper copies or digitally under license on their online store.
However, you can find free charts via FltPlan.com. (If using the mobile app, be sure to specifically download the Canadian VNCs, not just the default US sectionals).
Canadian Airspace Viewer is another useful site that shows Canadian airspace on top of a Google Map.
VNC Chart Projection
Section titled “VNC Chart Projection”All charts are created using a technique called projection and there are many different projections.
The Mercator Projection
Section titled “The Mercator Projection”The most commonly used projection is the Mercator projection, where parallels and meridians are perpendicular to each other. Road maps and topographic maps use this projection.
Why it is bad for aviation: The closest distance between two points is a curve, and the scale of the chart changes with latitude. This makes it challenging to accurately plan an aircraft flight.
The Lambert Conformal Conic Projection
Section titled “The Lambert Conformal Conic Projection”VNC maps use the Lambert conformal conic projection. To understand this, imagine a light source located right above the North Pole that shines downward on a transparent half globe and projects whatever lines are on the globe onto a flat sheet of paper placed at the equator.
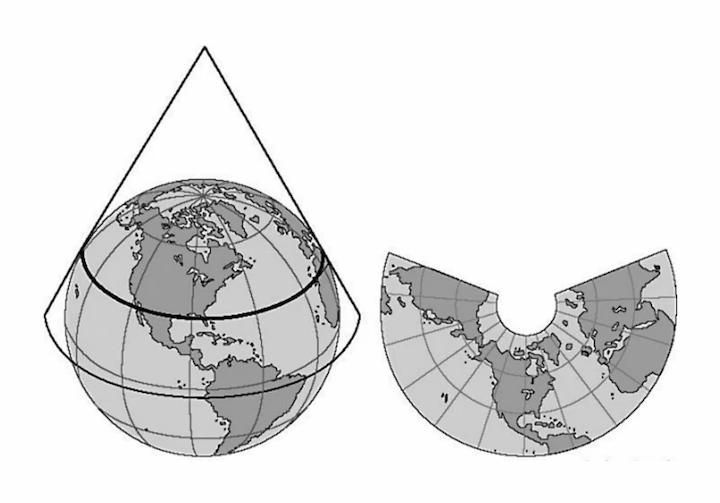
This projection has two major advantages for air navigation:
- A straight line on the chart corresponds roughly to a “great circle,” which is the shortest distance between two points.
- The scale on the chart is identical everywhere, making it easy to use a ruler and a protractor to plan a flight.
The main disadvantage of a conic projection is that the parallels and meridians do not intersect at 90-degree angles, making it a bit more challenging to locate a point on a map.